Latest Financials
Condensed Interim Financial Statements For the 6 Months Ended 30 September 2025 (For the Financial Year Ending 31 March 2026)
Consolidated Income Statement
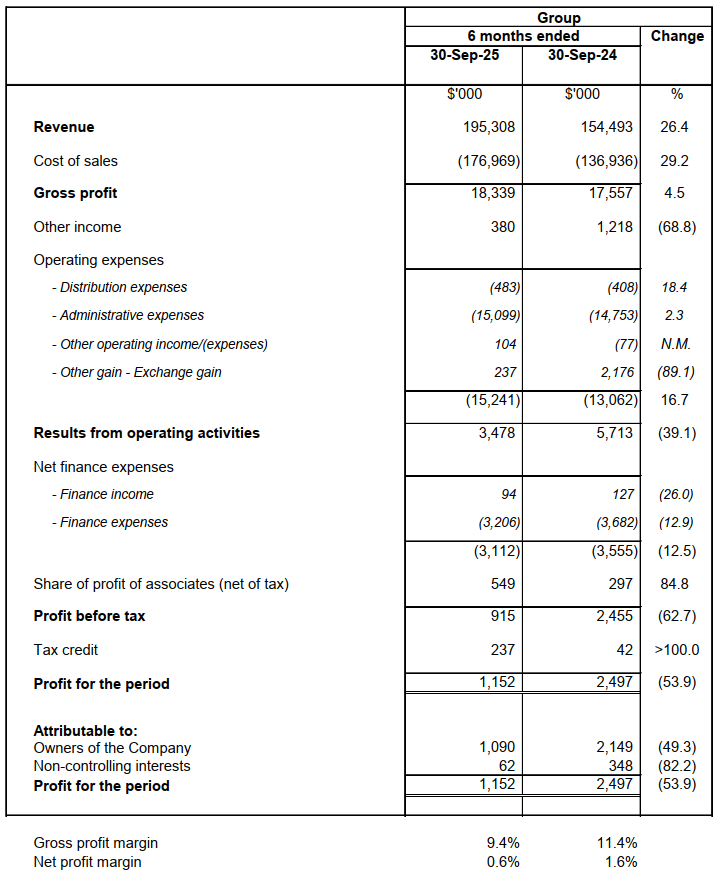
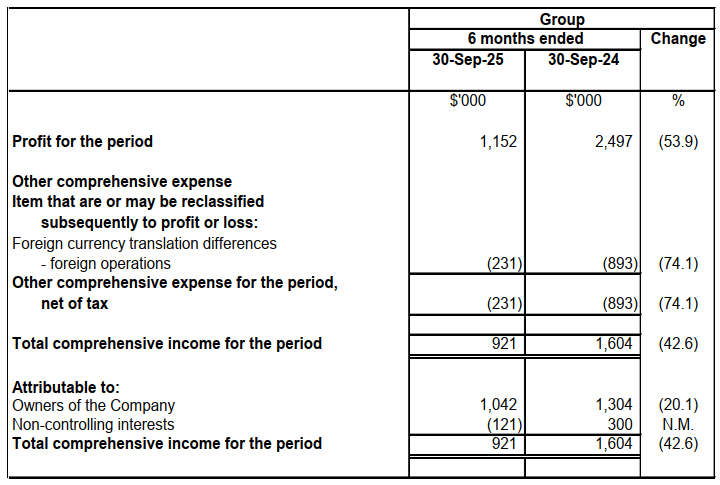
Consolidated Statement of Comprehensive Income
Statement of Financial Position
Review of the Performance of the Group
Consolidated Statement of Profit or Loss
1HFY26 – for the 6 months ended 30 September 2025
2HFY25 – for the 6 months ended 31 March 2025
1HFY25 – for the 6 months ended 30 September 2024
Review of Results for the 6 Months Ended 30 September 2025

Revenue
The Group recorded a revenue of $195.3 million for 1HFY26, representing a 26.4% and 6.5% increase over the $154.5 million and $183.3 million recorded in 1HFY25 and 2HFY25 respectively. The improvement reflects the higher level of construction activity in 1HFY26.
Gross Profit
The Group’s gross profit and gross profit margin for 1HFY26 were $18.3 million and 9.4% respectively (1HFY25: $17.6 million and 11.4%; 2HFY25: $17.8 million and 9.7%). The lower gross profit margin in 1HFY26 was mainly due to certain lower-margin projects undertaken in Malaysia. This was partially mitigated by the stronger margins in Singapore.
Other Income

As part of the Group’s ongoing fleet renewal programme, older equipment is disposed of and replaced with newer and more efficient models.
The Group recorded lower other income of $0.4 million for 1HFY26 (1HFY25: $1.2 million; 2HFY25: $1.1 million), mainly due to a lower gain from the disposal of old equipment in 1HFY26.
Operating Expenses
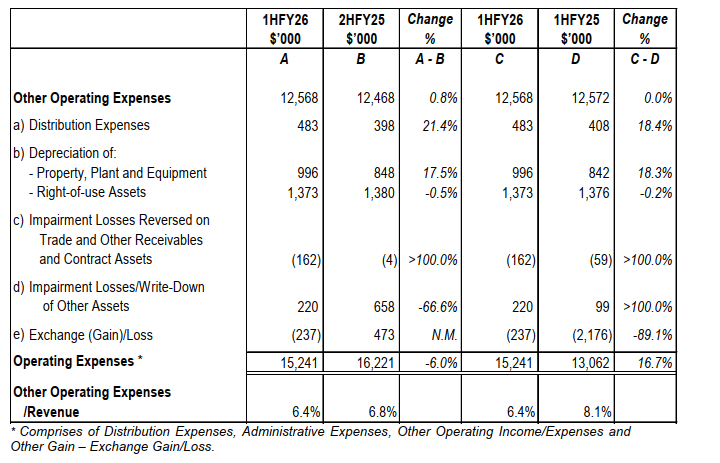
Other Operating expenses for 1HFY26 of $12.6 million were relatively unchanged compared to the $12.6 million in 1HFY25 and $12.5 million in 2HFY25.
The depreciation of right-of-use assets in 1HFY26 largely comprised a depreciation charge of $1.2 million (1HFY25: $1.2 million; 2HFY25: $1.2 million) recorded in relation to the Group’s headquarters located at No 2, Tanjong Penjuru Crescent (“2TPC”).
Foreign exchange gain of $0.2 million for 1HFY26 (1HFY25: $2.2 million; 2HFY25: exchange loss of $0.5 million) was due to the strengthening of the Malaysia Ringgit (“MYR”) and Thailand Baht (“THB”) against the Singapore Dollar (“SGD”). Between March 2025 and September 2025, the MYR and THB had strengthened by approximately 1% each against SGD.
Net Finance Expenses
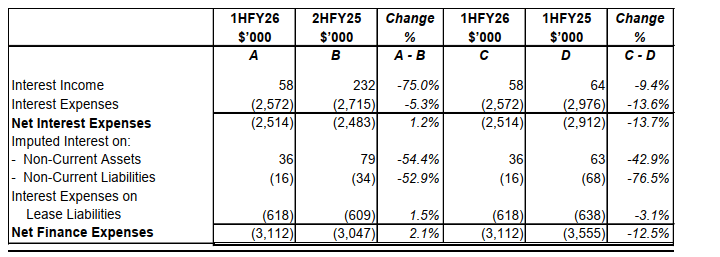
Net interest expenses declined to $2.5 million for 1HFY26 (1HFY25: $2.9 million), mainly due to reduced drawdown of floating interest rate trade facilities, coupled with lower floating interest rates charged by financial institutions during the period. Since December 2023, the Group has launched a multi-series unsecured commercial paper facility programme (“SDAX CP Facility Programme”) to progressively replace higher-cost loans as part of ongoing efforts to reduce borrowing costs.
Net interest expenses for 1HFY26 were relatively unchanged compared to the $2.5 million in 2HFY25.
The Group recognised an interest expense of $0.5 million for 1HFY26 (1HFY25: $0.5 million; 2HFY25: $0.6 million), in respect of the lease liability relating to 2TPC.
Share of Profit of Associates

The Group recorded a share of profit of $0.6 million from its associates’ business operations in 1HFY26 (1HFY25: $0.5 million; 2HFY25: $0.8 million), partially offset by the revaluation losses of an investment property held by an associate.
Profit for the period
In view of the above, the Group recorded a net profit for the period of $1.2 million in 1HFY26 (1HFY25: $2.5 million; 2HFY25: $0.05 million).
Earnings before interest, tax, depreciation and amortization (EBITDA) amounted to $15.3 million in 1HFY26 (1HFY25: $17.5 million; 2HFY25: $14.0 million).
Earnings per share was 0.03 cent for 1HFY26 (1HFY25: 0.06 cent; 2HFY25: loss per share of 0.01 cent).
Statement Of Financial Position
Non-Current Assets
Property, Plant and Equipment
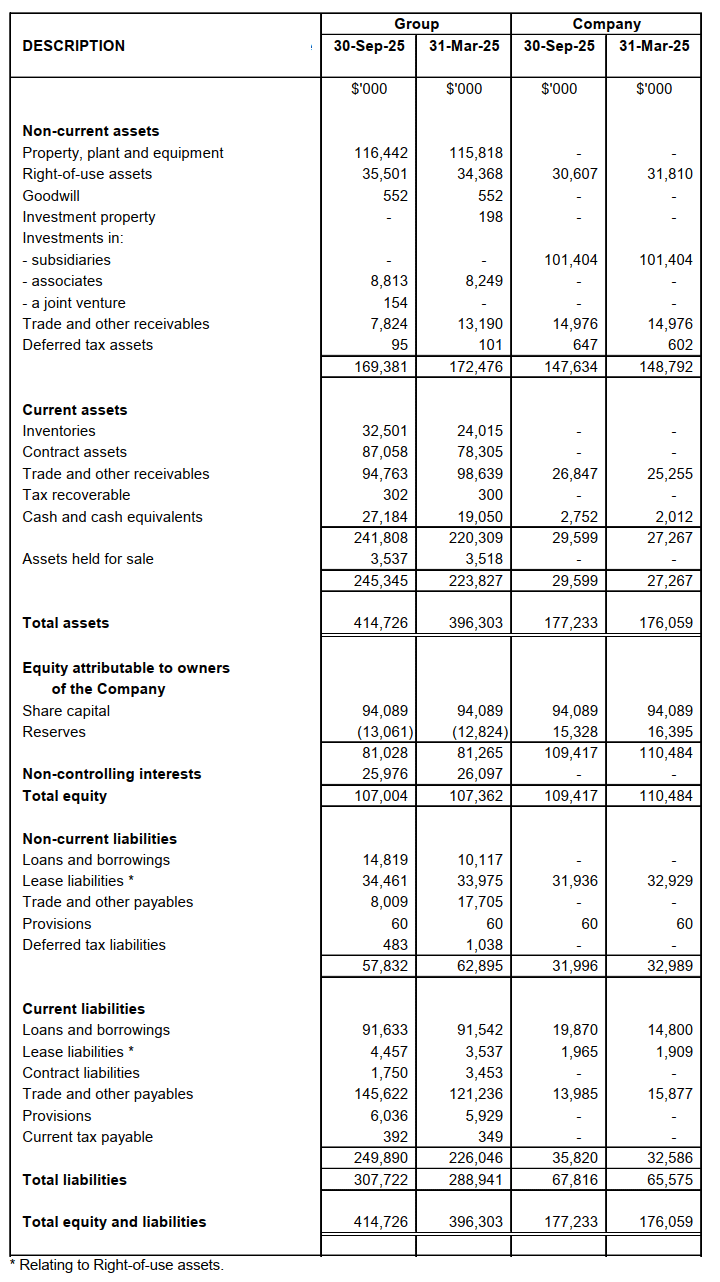
Net book value of property, plant and equipment (“PPE”) stood at $116.4 million as at 30 September 2025 (31 March 2025: $115.8 million).
In 1HFY26, the Group invested $9.8 million in new PPE as part of its ongoing fleet renewal programme. In addition, the Group reclassified $0.5 million of inventories as PPE following a reassessment of their economic use and, conversely, reclassified $0.2 million of PPE as inventories.
Plant and equipment with carrying values of $0.6 million were disposed of in 1HFY26, resulting in a $0.2 million gain. Depreciation charge for 1HFY26 amounted to $8.6 million (1HFY25: $8.9 million).
Right-of-use Assets
As at 30 September 2025, right-of-use asset and lease liability relating to 2TPC amounted to $30.6 million (31 March 2025: $31.8 million) and $33.9 million (31 March 2025: $34.8 million) respectively.
Net Current Liabilities
As at 30 September 2025, net current liabilities stood at $4.5 million (31 March 2025: $2.2 million). Current ratio (defined as current assets divided by current liabilities) was 0.98 (31 March 2025: 0.99).
Notwithstanding the Group’s net current liability position as at 30 September 2025, the Group has assessed the sources of liquidity and funding available to the Group, believes that the Group will be able to meet its obligations due within the next 12 months. These include committed unutilised credit facilities (which also contains overdraft facilities) of $30 million as at 30 September 2025 (31 March 2025: $29 million), projected net operating cash inflows for the next 12 months and available cash reserves as at 30 September 2025 to finance the Group’s working capital and day-to-day operation requirements.
In addition, the Group held higher inventories of $32.5 million as at 30 September 2025 (31 March 2025: $24.0 million), to support the anticipated increase in construction, equipment sales and leasing activities.
Trade and other receivables and contract assets increased by $4.9 million to $181.8 million (31 March 2025: $176.9 million), mainly due to the higher level of construction activity in 1HFY26. The Group continues to actively expedite the collections of receivables to manage working capital efficiently.
Trade and other payables and contract liabilities increased by $22.7 million to $147.4 million (31 March 2025: $124.7 million), in tandem with the higher business activity. The increase was also attributable to timing differences arising from the reclassification of current trade payables to non-current trade payables, in relation to the purchase of equipment held for sale under instalment arrangements; as well as payments to suppliers for the purchase of new PPE.
As at 30 September 2025, assets held for sale stood at $3.5 million (31 March 2025: $3.5 million).
Loans and Borrowings
The Group’s loans and borrowings stood at $106.5 million as at 30 September 2025 (31 March 2025: $101.7 million). Of these, $61.6 million or 58%, comprised floating interest rate loans (31 March 2025: $67.8 million, 67%), taking into account the net repayment of such loans in 1HFY26. The increase in total loans and borrowings was mainly due to the drawdown of new finance lease loans to fund the acquisition of equipment and refinancing of encumbered equipment in 1HFY26.
In 1HFY26, the Group issued $25.3 million in unsecured commercial papers under the SDAX CP Facility Programme, of which $20.1 million matured and were fully redeemed by external parties. As at 30 September 2025, outstanding commercial papers amounted to $17.9 million (31 March 2025: $12.7 million), bearing interests rates ranging from 4.5% to 5.2% per annum and maturities between 18 December 2025 and 18 March 2026.
The Group’s debt-to-equity ratio was 0.99 as at 30 September 2025 (31 March 2025: 0.95).
Equity and Net Asset Value
In 1HFY26, the Group repurchased 5.0 million ordinary shares for a total consideration of $0.06 million. Following this, 99.1 million shares with carrying values of $3.3 million were held as treasury shares as at 30 September 2025 (31 March 2025: 94.1 million shares with $3.2 million).
As at 30 September 2025, the Group’s total equity stood at $107.0 million (31 March 2025: $107.4 million), while net asset value per ordinary share was 3.1 cents (31 March 2025: 3.1 cents).
Cash Flow

Cash Flow from Operating Activities
The Group generated positive cash flows from operating activities with a net cash inflow of $18.8 million for 1HFY26 (1HFY25: $5.3 million; 2HFY25: $6.7 million). This was a result of focused working capital management and efforts to expedite the collections of trade receivables.
Cash Flow from Investing Activities
Net cash outflow from investing activities increased to $5.0 million for 1HFY26 (1HFY25: $0.8 million; 2HFY25: $2.9 million), mainly due to higher capital expenditure incurred as part of the Group’s fleet renewal programme in 1HFY26.
Cash Flow from Financing Activities
Net cash outflow from financing activities for 1HFY26 amounted to $4.3 million (1HFY25: $9.6 million), mainly due to lower net repayment of bank borrowings. In 1HFY26, the Group raised $5.2 million from the issuance of commercial papers under the SDAX CP Facility Programme (1HFY25: $4.6 million). The Group also paid dividends of $1.2 million to the shareholders in 1HFY26 in respect of the financial year ended 31 March 2025.
In 2HFY25, the Group recorded a net cash inflow of $1.6 million, taking into account the higher utilisation of trade facilities and proceeds from the issuance of commercial papers to support the business operations.
Cash and Cash Equivalents
As at 30 September 2025, the Group’s cash and cash equivalents stood at $25.5 million, compared to $10.9 million as at 30 September 2024 and $16.3 million as at 31 March 2025.
Outlook
The Singapore construction sector is expected to remain positive over the next 12 months, supported by major public infrastructure and residential projects, including the expansion of the rail network and the increase in public housing supply. Continued foreign investments in biologics, pharmaceuticals and semiconductors are also expected to sustain industrial developments. With tender activity and competition expected to intensify, contractors with strong technical capabilities and proven reliability will be well positioned to capture emerging opportunities.
Since the start of FY2026, the Group has secured over $170 million in new contracts, mainly in public residential projects and pharmaceutical developments, leveraging its geotechnical and foundation engineering expertise.
To strengthen its value proposition, the Group is establishing a service centre through three joint ventures with specialised Chinese servicing partners. This initiative is expected to enhance its servicing and maintenance capabilities to meet the sustained demand arising from the influx of China-origin foundation equipment into Singapore. This transaction is not expected to have a material effect on the consolidated earnings per share or net tangible assets per share of the Group for the financial year ending 31 March 2026. Please refer to the Group’s announcement dated 26 September 2025 for details.
Amid rising manpower costs and competitive market conditions, the Group remains disciplined in project selection, focusing on contracts with sound margins and manageable risks, while maintaining strict liquidity and capital discipline.
As at 31 October 2025, the Group’s order book stood at $270 million (30 April 2025: $300 million), with the majority of projects to be delivered within the next 12 months.


